


Note
Click here to download the full example code
PyTorch Profiler
本教程解释了如何使用PyTorch profiler,并测量模型算子的时间和内存消耗。
简介
当用户需要确定模型中最耗费资源的算子时,PyTorch包含一个简单的profiler API非常有用。
在本教程中,我们将使用一个简单的 Resnet 模型来演示如何使用profiler分析模型性能。
具体步骤
导入所有必需的库
实例化一个简单的Resnet模型
使用profiler分析执行时间
使用profiler分析内存消耗
使用跟踪功能
检查堆栈跟踪
使用profiler分析长时间运行的作业
1. 导入依赖的库
在本教程中,我们将使用 torch、torchvision.models 和 profiler 模块:
import torch
import torchvision.models as models
from torch.profiler import profile, ProfilerActivity, record_function
2. 创建一个简单的 Resnet 模型
让我们创建一个 Resnet 模型实例,并为它准备一个输入:
model = models.resnet18()
inputs = torch.randn(5, 3, 224, 224)
3. 使用profiler分析执行时间
PyTorch profiler通过上下文管理器启用,并接受多个参数,其中一些最有用的参数如下:
activities- 要分析的活动列表:ProfilerActivity.CPU- PyTorch算子、TorchScript函数和用户定义的代码标签(见下面的record_function);ProfilerActivity.CUDA- 设备上的CUDA内核;
record_shapes- 是否记录算子输入的形状;profile_memory- 是否报告模型张量所消耗的内存量;use_cuda- 是否测量CUDA内核的执行时间。
注意:当使用CUDA时,profiler还会显示主机上发生的运行时CUDA事件。
让我们看看如何使用profiler分析执行时间:
with profile(activities=[ProfilerActivity.CPU], record_shapes=True) as prof:
    with record_function("model_inference"):
        model(inputs)
注意,我们可以使用 record_function 上下文管理器为任意代码范围添加用户提供的名称标签
(在上面的示例中使用 model_inference 作为标签)。
Profiler允许检查在使用profiler上下文管理器包装的代码范围内执行期间调用了哪些算子。
如果同时存在多个活动的profiler范围(例如在并行PyTorch线程中),每个profiling上下文管理器只跟踪其对应范围的算子。
Profiler还会自动分析使用 torch.jit._fork 启动的异步任务,以及在反向传播过程中使用 backward() 调用启动的反向传播算子。
让我们打印出上述执行的统计信息:
print(prof.key_averages().table(sort_by="cpu_time_total", row_limit=10))
输出将如下所示(省略了一些列):
# ---------------------------------  ------------  ------------  ------------  ------------
#                              Name      Self CPU     CPU total  CPU time avg    # of Calls
# ---------------------------------  ------------  ------------  ------------  ------------
#                   model_inference       5.509ms      57.503ms      57.503ms             1
#                      aten::conv2d     231.000us      31.931ms       1.597ms            20
#                 aten::convolution     250.000us      31.700ms       1.585ms            20
#                aten::_convolution     336.000us      31.450ms       1.573ms            20
#          aten::mkldnn_convolution      30.838ms      31.114ms       1.556ms            20
#                  aten::batch_norm     211.000us      14.693ms     734.650us            20
#      aten::_batch_norm_impl_index     319.000us      14.482ms     724.100us            20
#           aten::native_batch_norm       9.229ms      14.109ms     705.450us            20
#                        aten::mean     332.000us       2.631ms     125.286us            21
#                      aten::select       1.668ms       2.292ms       8.988us           255
# ---------------------------------  ------------  ------------  ------------  ------------
# Self CPU time total: 57.549m
#
To get a finer granularity of results and include operator input shapes, pass group_by_input_shape=True
(note: this requires running the profiler with record_shapes=True):
这里我们可以看到,如预期的那样,大部分时间都花在了卷积上(对于使用 MKL-DNN 支持编译的PyTorch,特别是在 mkldnn_convolution 上)。
注意自身cpu时间和cpu时间之间的区别 - 算子可以调用其他算子,自身cpu时间不包括在子算子调用中花费的时间,而总cpu时间包括了它。
你可以通过将 sort_by="self_cpu_time_total" 传递给 table 调用来选择按自身cpu时间排序。
要获得更细粒度的结果并包含算子输入形状,请传递 group_by_input_shape=True
(注意:这需要使用 record_shapes=True 运行profiler):
print(
    prof.key_averages(group_by_input_shape=True).table(
        sort_by="cpu_time_total", row_limit=10
    )
)
输出可能如下所示(省略了一些列):
---------------------------------  ------------  -------------------------------------------
                             Name     CPU total                                 Input Shapes
---------------------------------  ------------  -------------------------------------------
                  model_inference      57.503ms                                           []
                     aten::conv2d       8.008ms      [5,64,56,56], [64,64,3,3], [], ..., []]
                aten::convolution       7.956ms     [[5,64,56,56], [64,64,3,3], [], ..., []]
               aten::_convolution       7.909ms     [[5,64,56,56], [64,64,3,3], [], ..., []]
         aten::mkldnn_convolution       7.834ms     [[5,64,56,56], [64,64,3,3], [], ..., []]
                     aten::conv2d       6.332ms    [[5,512,7,7], [512,512,3,3], [], ..., []]
                aten::convolution       6.303ms    [[5,512,7,7], [512,512,3,3], [], ..., []]
               aten::_convolution       6.273ms    [[5,512,7,7], [512,512,3,3], [], ..., []]
         aten::mkldnn_convolution       6.233ms    [[5,512,7,7], [512,512,3,3], [], ..., []]
                     aten::conv2d       4.751ms  [[5,256,14,14], [256,256,3,3], [], ..., []]
---------------------------------  ------------  -------------------------------------------
Self CPU time total: 57.549ms
注意 aten::convolution 出现了两次,具有不同的输入形状。
Profiler也可用于分析在GPU上执行的模型的性能:
model = models.resnet18().cuda()
inputs = torch.randn(5, 3, 224, 224).cuda()

with profile(
    activities=[ProfilerActivity.CPU, ProfilerActivity.CUDA], record_shapes=True
) as prof:
    with record_function("model_inference"):
        model(inputs)

print(prof.key_averages().table(sort_by="cuda_time_total", row_limit=10))
(注意:第一次使用CUDA分析可能会带来额外的开销。)
结果输出(省略了一些列):
-------------------------------------------------------  ------------  ------------
                                                   Name     Self CUDA    CUDA total
-------------------------------------------------------  ------------  ------------
                                        model_inference       0.000us      11.666ms
                                           aten::conv2d       0.000us      10.484ms
                                      aten::convolution       0.000us      10.484ms
                                     aten::_convolution       0.000us      10.484ms
                             aten::_convolution_nogroup       0.000us      10.484ms
                                      aten::thnn_conv2d       0.000us      10.484ms
                              aten::thnn_conv2d_forward      10.484ms      10.484ms
void at::native::im2col_kernel<float>(long, float co...       3.844ms       3.844ms
                                      sgemm_32x32x32_NN       3.206ms       3.206ms
                                  sgemm_32x32x32_NN_vec       3.093ms       3.093ms
-------------------------------------------------------  ------------  ------------
Self CPU time total: 23.015ms
Self CUDA time total: 11.666ms
注意在输出中出现了设备上的内核(例如 sgemm_32x32x32_NN)。
4. 使用 profiler 分析内存消耗
PyTorch profiler还可以显示在执行模型算子期间分配(或释放)的内存量(由模型张量使用)。
在下面的输出中,’self’内存对应于算子分配(释放)的内存,不包括对其他算子的子调用。
要启用内存分析功能,请传递 profile_memory=True。
model = models.resnet18()
inputs = torch.randn(5, 3, 224, 224)

with profile(
    activities=[ProfilerActivity.CPU], profile_memory=True, record_shapes=True
) as prof:
    model(inputs)

print(prof.key_averages().table(sort_by="self_cpu_memory_usage", row_limit=10))

# (omitting some columns)
# ---------------------------------  ------------  ------------  ------------
#                              Name       CPU Mem  Self CPU Mem    # of Calls
# ---------------------------------  ------------  ------------  ------------
#                       aten::empty      94.79 Mb      94.79 Mb           121
#     aten::max_pool2d_with_indices      11.48 Mb      11.48 Mb             1
#                       aten::addmm      19.53 Kb      19.53 Kb             1
#               aten::empty_strided         572 b         572 b            25
#                     aten::resize_         240 b         240 b             6
#                         aten::abs         480 b         240 b             4
#                         aten::add         160 b         160 b            20
#               aten::masked_select         120 b         112 b             1
#                          aten::ne         122 b          53 b             6
#                          aten::eq          60 b          30 b             2
# ---------------------------------  ------------  ------------  ------------
# Self CPU time total: 53.064ms

print(prof.key_averages().table(sort_by="cpu_memory_usage", row_limit=10))
输出如下所示(省略了一些列):
---------------------------------  ------------  ------------  ------------
                             Name       CPU Mem  Self CPU Mem    # of Calls
---------------------------------  ------------  ------------  ------------
                      aten::empty      94.79 Mb      94.79 Mb           121
                 aten::batch_norm      47.41 Mb           0 b            20
     aten::_batch_norm_impl_index      47.41 Mb           0 b            20
          aten::native_batch_norm      47.41 Mb           0 b            20
                     aten::conv2d      47.37 Mb           0 b            20
                aten::convolution      47.37 Mb           0 b            20
               aten::_convolution      47.37 Mb           0 b            20
         aten::mkldnn_convolution      47.37 Mb           0 b            20
                 aten::max_pool2d      11.48 Mb           0 b             1
    aten::max_pool2d_with_indices      11.48 Mb      11.48 Mb             1
---------------------------------  ------------  ------------  ------------
Self CPU time total: 53.064ms
5. 使用跟踪功能
可以将分析结果输出为 .json 跟踪文件:
model = models.resnet18().cuda()
inputs = torch.randn(5, 3, 224, 224).cuda()

with profile(activities=[ProfilerActivity.CPU, ProfilerActivity.CUDA]) as prof:
    model(inputs)

prof.export_chrome_trace("trace.json")
你可以在Chrome跟踪查看器(chrome://tracing)中检查分析的算子和CUDA内核序列:
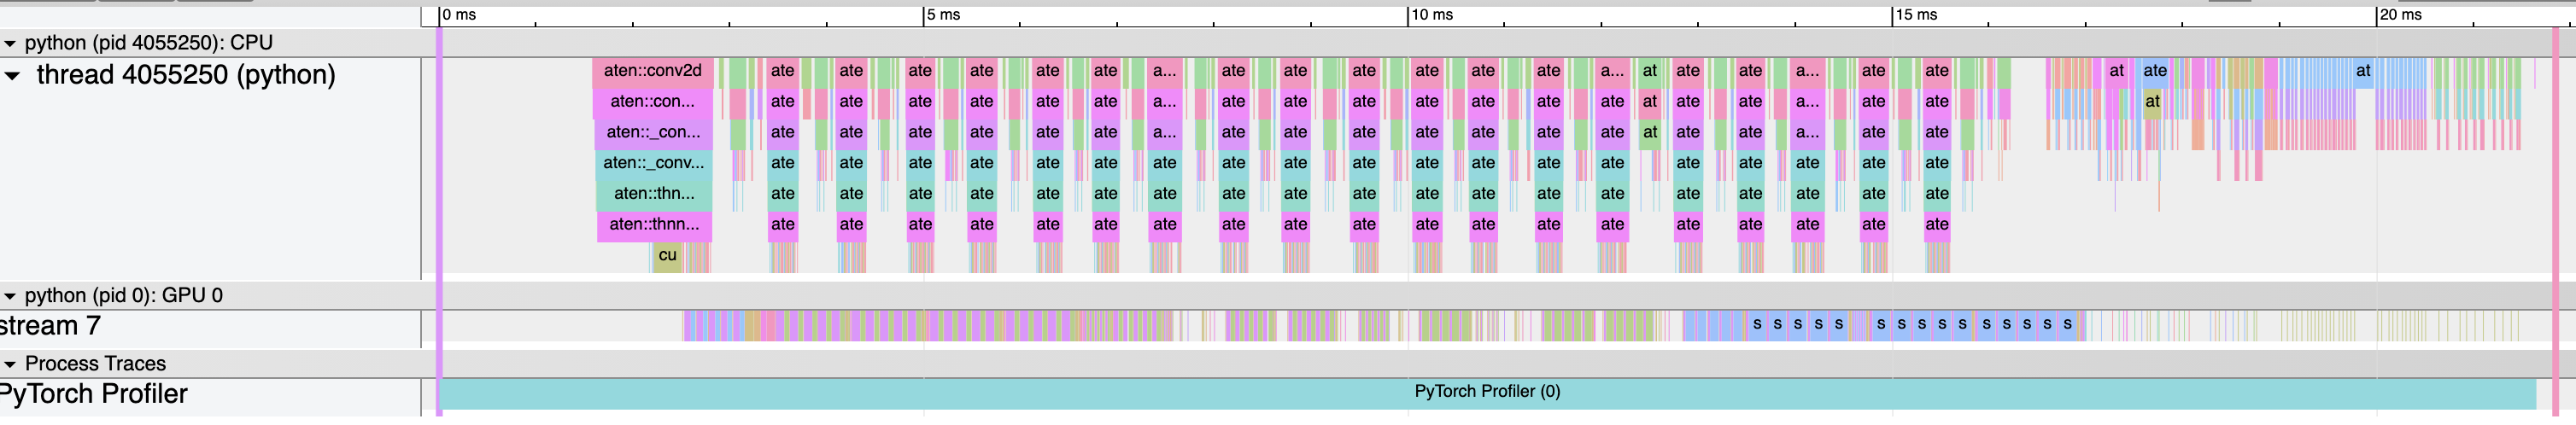
6. 检查堆栈跟踪
Profiler 可用于分析 Python 和 TorchScript 堆栈跟踪:
with profile(
    activities=[ProfilerActivity.CPU, ProfilerActivity.CUDA],
    with_stack=True,
) as prof:
    model(inputs)

# Print aggregated stats
print(
    prof.key_averages(group_by_stack_n=5).table(
        sort_by="self_cuda_time_total", row_limit=2
    )
)
输出如下所示(省略了一些列):
-------------------------  -----------------------------------------------------------
                     Name  Source Location
-------------------------  -----------------------------------------------------------
aten::thnn_conv2d_forward  .../torch/nn/modules/conv.py(439): _conv_forward
                           .../torch/nn/modules/conv.py(443): forward
                           .../torch/nn/modules/module.py(1051): _call_impl
                           .../site-packages/torchvision/models/resnet.py(63): forward
                           .../torch/nn/modules/module.py(1051): _call_impl
aten::thnn_conv2d_forward  .../torch/nn/modules/conv.py(439): _conv_forward
                           .../torch/nn/modules/conv.py(443): forward
                           .../torch/nn/modules/module.py(1051): _call_impl
                           .../site-packages/torchvision/models/resnet.py(59): forward
                           .../torch/nn/modules/module.py(1051): _call_impl
-------------------------  -----------------------------------------------------------
Self CPU time total: 34.016ms
Self CUDA time total: 11.659ms
注意在 torchvision/models/resnet.py 脚本中的两个卷积和两个调用位置。
(警告:堆栈跟踪会增加额外的分析开销。)
7. 使用分析器分析长时间运行的作业
PyTorch分析器提供了一个额外的API来处理长时间运行的作业 (例如训练循环)。跟踪所有执行可能会很慢,并导致非常大的跟踪文件。 为了避免这种情况,可以使用可选参数:
schedule- 指定一个函数,该函数以整数参数(步骤编号)作为输入, 并返回分析器的操作,使用此参数的最佳方式是使用torch.profiler.schedule帮助函数,它可以为您生成一个计划;on_trace_ready- 指定一个函数,该函数以分析器的引用作为输入, 并在每次新的跟踪准备就绪时由分析器调用。
为了说明该API的工作原理,让我们首先考虑以下使用 torch.profiler.schedule
帮助函数的示例:
分析器假设长时间运行的作业由从零开始编号的步骤组成。 上面的示例为分析器定义了以下操作序列:
参数
skip_first告诉分析器它应该忽略前10个步骤 (skip_first的默认值为零);在第一个
skip_first步骤之后,分析器开始执行分析器周期;每个周期由三个阶段组成:
可选的
repeat参数指定周期的上限。 默认情况下(零值),分析器将尽可能长时间地执行周期。
因此,在上面的示例中,分析器将跳过前15个步骤,在下一步进行预热,
在接下来的3个步骤中主动记录,再跳过另外5个步骤,在下一步进行预热,
在另外3个步骤中主动记录。由于指定了 repeat=2 参数值,
分析器将在前两个周期之后停止记录。
在每个周期结束时,分析器调用指定的 on_trace_ready 函数并将自身作为参数传递。
此函数用于处理新的跟踪 - 通过获取表输出或将输出保存到磁盘上的跟踪文件。
要向分析器发送下一步已经开始的信号,请调用 prof.step() 函数。
当前分析器步骤存储在 prof.step_num 中。
以下示例显示了如何使用上述所有概念:
def trace_handler(p):
    output = p.key_averages().table(sort_by="self_cuda_time_total", row_limit=10)
    print(output)
    p.export_chrome_trace("/tmp/trace_" + str(p.step_num) + ".json")


with profile(
    activities=[ProfilerActivity.CPU, ProfilerActivity.CUDA],
    schedule=torch.profiler.schedule(wait=1, warmup=1, active=2),
    on_trace_ready=trace_handler,
) as p:
    for idx in range(8):
        model(inputs)
        p.step()
